sambrunacini.com
Building a 3d boat in desmos.
The graphing calculator Desmos recently held a competition called the Global Math Art Contest. People aged 13-18 submitted artwork they created with the graphing calculator using combinations of math curves. The judging is based on creativity, originality, visual appeal, and the math used to create the art. As a person with little artistic talent, I had to rely on the use of math category to get my edge. So I decided to create a rotatable 3D boat that moves and tilts according to the waves in the water below it. Here I’ll explain how I went about doing this. Finished project: https://www.desmos.com/calculator/fcxzjdabm1

“Modifying” the in-browser calculator
By default, Desmos only supports 6 different colors and none of them are really optimal for a boat. I wanted to use brown for the boat and light blue for the water beneath it. I opened developer tools in Chrome to see how I could add additional colors. As it turns out, Desmos defines an instance of the calculator called Calc that can be changed from the client side. After looking at the Desmos API documentation for a little bit I was able to figure out how to modify the available colors. I used a Chrome extension called Tampermonkey to automatically execute my color adding script after the calculator loads. Here’s the script:
Doing this might actually disqualify me from the contest.. but I checked the rules and there was no mention of using the Desmos API. It just said that the art had to be done in the online calculator, which it was. I won’t know for sure if it’s allowed until the results are announced in the second half of May.
Preparing to draw in 3D
Since Desmos is strictly a 2D graphing calculator, I had to implement my own algorithms for drawing in three dimensions. I’ve already worked out how to project from 3D world space to a 2D canvas on a screen because I needed to do that for MathGraph3D. The algorithm I implemented in Desmos is actually the OLD version of my 3D to 2D algorithm. Here is the derivation.
The basic idea is to figure out the screen coordinates of each 3D unit vector. First, we must have a way to define orientation. Call $\alpha$ the angle formed between the positive $x$ axis and a fixed vertical axis, and call $\beta$ the angle between the positive $x$ axis and a fixed horizontal axis. If $\vec{i}$, $\vec{j}$, and $\vec{k}$ are the standard unit vectors for $\mathbb{R}^3$, their projections are
$$ \vec{i}_{\text{proj}} = \left(\cos\left(\alpha\right),\sin\left(\alpha\right)\sin\left(\beta\right)\right)$$
$$ \vec{j}_{\text{proj}} = \left(-\sin\left(\alpha\right),\cos\left(\alpha\right)\sin\left(\beta\right)\right) $$
$$\vec{k}_{\text{proj}} = \left(0,\cos\left(\beta\right)\right) $$
Now, the boundaries of the 3D space must be defined. To keep things simple I decided to make the space a cube. So in the graph the value $s_{tart}$ is necessarily negative and defines the lower bound for the space in each dimension. Then $s_{top} = -s_{tart}$ defines the upper bound and $u_{nits} = s_{top} – s_{tart}$ is the number of units in each direction. I disabled the gridlines, axis numbers, and axes so the graph is just a blank white page by this point.
The top of the water is the surface of a function of two variables. I wanted it to look quite realistic, so I experimented with some functions to create ripples and waves. I took advantage of the wavy nature of sinusoid functions to do this. But that comes with a different challenge: sines and cosines are periodic, and I didn’t want the waves to look like a simple pattern that repeats itself over and over. To avoid this, I messed with the period and amplitude of a sine wave and a cosine wave, then added a constant to the argument of the cosine to translate it in and out of phase with the sine. When the constant’s value is animated, the function looks like this:
(This function is defined by $w_{1}\left(x\right)=\frac{1}{4}\left(\sin\left(x\right)+\frac{1}{2}\cos\left(2x-b_{0}\right)\right)$ where $b_0$ is the constant)
Next, I defined another function $w_{2}\left(x\right)$ that is exactly the same as $w_{1}\left(x\right)$ except the constant $b_0$ is subtracted from the argument of cosine, not added. Finally, to make an occasional really big wave, I defined another function $w_{3}\left(x\right)=2e^{-\frac{1}{16}\left(x-a_{0}\right)^{2}}$. This is a scaled normal distribution with mean $a_0$. When $a_0$ is animated, the function looks like this:
These are all the tools needed to create the final water function $W\left(x,y\right)$. Here is its definition:
$$|x+y|+|x-y|\le u_{nits}:w_{1}\left(x\right)+w_{2}\left(y\right)+w_{3}\left(x+y\right)$$
The condition on that function tests if the point $(x,y)$ is in the portion of the $xy$-plane being drawn to the screen. This is needed for drawing the polygons at the side of the water to shade from the surface of the water to the bottom of the space. Notice that $w_1$ acts in the $x$ direction, $w_2$ acts in the $y$ direction, and $w_3$ acts in the $x+y$ direction, or diagonally. This creates more wave interference and thus further removes the feeling that the ripples are just a repeated pattern. Here’s what it looks like so far:
Change of basis
In reality, when I was making this project I created the boat first then added change of basis later. However, it makes more sense to explain it this way. Change of basis in this context means defining a new linearly independent set of basis unit vectors for $\mathbb{R}^3$ such that the $z$ unit vector is normal to the surface of the water under the boat. Let the new basis be $\{e_1,e_2,e_3\}$. Then $e_1$ is calculated by taking the vector difference between $(-l, 0, W(-l,0))$ and $(l, 0, W(l,0))$ where $l$ is the length of the boat. $e_2$ is the vector difference between $(0, -w, W(0, -w))$ and $(0, w, W(0, w))$ where $w$ is the width of the boat. $e_3$ is the cross product $e_1 \times e_2$. Finally, these vectors are all normalized.
Now, by multiplying the coordinates of each point on the boat by the corresponding vector in the new basis, the boat will tilt in both directions according to the shape of the water beneath it. It’s a bit hard to tell that it’s working until the big wave comes by and the boat dramatically tilts forward.
This was by far the hardest part because I’m not an artist and ruining the project with a poorly done boat would have been disappointing. But I managed to put together a pretty decent boat that, honestly, turned out better than I expected. I defined three functions $g_1$, $g_2$, and $g_3$. $g_1$ defines the shape of the boat along the front to back direction, $g_2$ defines the shape along the side to side direction, and $g_3$ is used to make the boat have curved (or “flared-out”) edges instead of straight sides. $g_1$ is a parabolic segment that is divided by the square of the boat length, so that it’s slightly curved upward but not too much. It looks like this:
$g_2$ is a hyperbolic cosine function divided by the square of the boat width. I tried a parabola at first but it was too round near the center.
$g_3$ is another normal distribution curve that depends on the width of the boat:
Putting these together, and using Desmos list magic to draw many of these curves, the boat looks like this:
Finally, I used a grid of sample $W$ values to determine the maximum height of the water near the boat. I translated the boat upwards by this amount divided by two so it stays near the surface but looks like it is displacing water.
The link to the final graph is near the top of this post. Thanks for reading!

Definitive resource hub on everything higher math
Bonus guides and lessons on mathematics and other related topics
- Definitive Guide to Learning Higher Mathematics
- Ultimate LaTeX Reference Guide
- Comprehensive List of Mathematical Symbols
- Math Tutoring / Consulting
- Higher Math Proficiency Test
- 10 Commandments of Higher Math Learning
- Math Vault Linear Algebra Ebook Series
- Recommended Math Books
- Recommended Math Websites
- Recommended Online Tools
Where we came from, and where we're going
Join us in contributing to the glory of mathematics
- Desmos Art: The Definitive Guide to Computational Sketching
Functions & Operations, General Math, Geometry, Graphing, Math Tools
- Functions & Operations
If you’re of the type who enjoys playing around with graphing calculator, then you might be interested in the so-called Desmos Art . These are basically pictures and animations created in Desmos primarily through the clever use of equations and inequalities — among other features such as tables , animating sliders and regression models . Indeed, if you go to this official staff pick page , you should see that a whole bunch of creative artworks were already being created — anything from cartoon characters , landscape to logos and portraits .
But here’s a problem: when you reach a Desmos artwork page, you get to see the end-result with all the equations and inequalities , without necessarily having any clue about how the sketching process comes about from the beginning to the end:
- Why does this weird-looking equation pop out from nowhere ?
- How did the author know that $3.982$ is the leading coefficient to use?
- And how did those numbers get so precise up to four decimals digits?
To remedy this situation, we came up with a laborious and interesting solution: we decided to go out there and create a new Desmos sketch from scratch, and work backward to comment a bit on the steps , procedures and reasoning involved in the sketching process — as we go through the different stages and portions of the drawing.
And with that, let’s proceed straight into our Desmos Art guide in computational sketching , which — as you might have guessed — is going to be both fun and informative — even if you have no intention whatsoever of using any graphing calculator in the near future.
Table of Contents
Step 1: Initial Setup — Source Picture
Unless you are some kind of sketching guru — which we certainly are not — it’s generally better to base the sketching on some underlying model: some picture that you actually want to draw; some picture that you can rely upon in case the sketching derails by a huge margin.
And in case it’s not clear enough, you should only choose a picture that you really, really enjoy sketching — something that you can derive a whole lot of satisfaction from. This is because unlike ordinary pencil-and-eraser sketching , sketching in Desmos has to be done by filling the command lines with equations , tables and inequalities , so that if you can’t fuel enough passion into a drawing, then the time and effort invested into reproducing it is probably not going to worth it.
Also, when choosing a picture, take good care to select one that is not too difficult to draw. Otherwise, you might have to regret your decision much later when you’re already, say, 21 hours into the process. Of course, you don’t want to make the picture too easy either, as it might not be much of a gratifying experience if you do it that way.
In our case, using the Reddit Gold membership recently awarded to us, we went out there and created our first very own signature Reddit alien avatar :

For the lack of better terms, let’s just call these lovely creatures Math Vault Redditlady and Redditdog , respectively. Now, does this logo make a good choice as a source image ? We certainly think it does:
- Passion Level : Since we only create avatars that we like, channeling energy into recreating the creatures invented in part by ourselves is definitely not an issue.
- Complexity : Both the Redditlady and the Redditdog have very well-defined borders and colors, making it a formidable challenge that’s not too intimidating.
And with both criteria passed, we proceed to happily import our avatar image into Desmos. By default, Desmos likes to set the origin $(0,0)$ as the center of the image, and that is a good choice for most purposes. However, depending on the size of the source image, sometimes it makes sense to consider rescaling it so that at the default zoom level , the image occupies around 70% of the graphing grid either in height or in width. If the image is too small, then it’s hard to appreciate any fine detail, and if it’s too big, then one might have a hard time focusing on the big picture — literally.
In our case, since the avatar is just about the right size to start with, we decided to keep the dimension of the image to the default $10 \times 10$ setting at the end. We also didn’t alter the image’s aspect ratio either, which in many cases aren’t really necessary anyway.
But just to drive the message home a bit, setting up a source image correctly from the get-go is more important than it seems, since the last thing we want to be doing is to, say, rescale the image to an appropriate size after being already halfway through the sketching process.
- Step 2: Divide and Conquer
How do you deal with a huge task that seems impossible to complete? You partition the task into smaller subtasks. That is, tasks that are so small that you actually enjoy doing them!
In particular, when it comes to sketching in Desmos, you want to section the picture into different portions , each of which can be finished in a reasonable amount of time, so that when it comes to the time of sketching, you focus on one single portion and one single portion only.
In our case, since we know that sketching the entire Redditlady and its companion pet can be quite a challenge, instead of resorting to despair, we divide the entire avatar into 6 portions — from the top to the bottom:
- Hat & Antenna
Hand & Rubik’s Cube
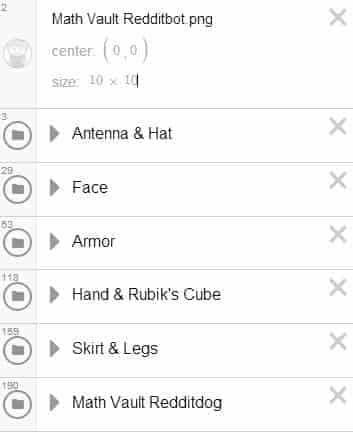
By inspection, while we see that most of these portions are relatively simple to implement, we still anticipate some challenges ahead of us when it comes to the Armor portion. In an attempt to make the Armor less intimidating, we proceed to subdivide it further into 7 subportions :
- Left Shoulder
- Right Shoulder
- “Lungs”
- “Outer Lungs”
With the gist of our organisational structure now settled, we then proceed to create a Desmos folder for each of the general portions, all of the while making a mental note that every command line pertaining to a specific portion should be dragged into its associated folder — if it’s not already in there.
And while Desmos doesn’t really support folder nesting at this point, there’s nothing preventing us from using comment lines to provide labels for the subportions. True, while this level of organization could be an overkill for a simple picture, as the complexity of the picture increases, structuring the command lines this way can make line identification and future reference substantially easier.
In our case for example, the need for quick reference became so urgent that towards the end of the sketching, we ended up creating far more subportions than we originally thought needed. Here’s our updated organisational structure at the completion of the avatar:
- Antenna & Hat
- Collar & Arms
- “Lungs” &”Outer Lungs”
(Yep. The Redditdog proved to be a bit more annoying than originally anticipated. Hence the saying “Don’t judge a puppy by its cover.”)
- Step 3: Portion Crunching
As mentioned a bit earlier, when working on a sketch, it’s often less intimidating to just focus on a portion while ignoring the rest. We call this portion crunching , and is done in part to ensure that the work completed with minimal resistance and mental blocks. In Desmos, portion crunching usually boils down to the following two parts: curving drawing and region coloring .
Step 3a: Drawing Curves
In general, a self-contained portion of an image is composed of close figures , which in turn can be construed as a series of curve segments . However, since these curve segments tend interact with each other, it would be hard for us to draw these segments sequentially — as would be done in ordinary pencil-and-eraser sketching. Instead, we prefer to resort to the strategy as outlined below:
Model a curve segment using an appropriate class of equations , and leave its graph with the full domain intact . Do the modeling for each of the curve segments in the close figure. Cut off the excessive parts of each curve — by imposing restrictions on the associated equation.
In particular, we want the curve trimming to happen at the very end, because once the curve modeling are done for each curve segment in a close figure, Desmos will map out all the intersection points along with their coordinates — the latter of which provide key information as to where to cut off the curves, and might not be available had we decided to trim the curves off from the get-go.
In actuality though, we’ll probably spend more time modeling the curve segments rather than trimming them — as there are simply too many curves in too many different shapes and forms. And while it might be hard to provide an exhaustive set of tips for modeling each curve segment we will ever encounter, the following procedures should be more than enough to take care of most of them.
Modeling Line Segments
Many close figures are composed of nothing but lines, and vertical/ horizontal line segments are about as easy as one can get. For example, to create the line segment connecting $(1.2, 5)$ with $(1.2, 5.67)$, simply typing $x=1.2 \, \{5\le y \le 5.67 \}$ into a command line will do just fine.
In general, if you know the coordinates of the two endpoints of a line segment, then you can enter them into a Desmos table , and re-configure the points (via the Gear Icon ) to have a line segment passing through it.
On the other hand, if you only have the coordinate of a single point on the line segment, say $(2.33,4.67)$, then you can still resort to the point-slope form , which in this case becomes $y=(x-2.33)+4.67$. In fact, by simply adjusting the slope one digit at a time, and observing the graph at an ever-increasing zoom level, it shouldn’t take long to obtain a line that reasonably overlaps with the segment you are trying to model.
Modeling Circular/Elliptical Segments
In some cases, the borders of objects (e.g., eyes, ring, hands) are either ellipses themselves, or can modeled using some elliptical arcs . In which case, the following modeling procedure could be useful:
Procedure for Modeling Elliptical Segments
- For a full circle or a full ellipse, use the general equation $\displaystyle (x-h)^2+(y-k)^2 = r^2$ (resp., $\displaystyle \frac{(x-h)^2}{a^2}+\frac{(y-k)^2}{b^2}$$=1$) in the command line. If the circular/elliptical segment is already part of the top-half , bottom-half , left-half or right-half of a circle/ellipse, then use the corresponding function instead — this is vital if the region is to be colored later on.
- Don’t worry about which numbers to use for the parameters $r$, $a$, $b$, $h$ and $k$ yet. Just put in some numbers into the command line so that the resulting graph is reasonably close to the segment being modeled.
- Start by tweaking the radius $r$ (or in the case of ellipse, the radii $a$ and $b$) so that the resulting graph looks “parallel” to the segment being modeled. Do it one decimal at a time, before zooming in and moving onto the next decimal.
- Once satisfied, adjust the center of the circle/ellipse $(h,k)$ to where you think it should be. Try to nail in the accuracy one decimal at a time, and zoom in the graph repeatedly as you get better and better fit.
- Repeat Step 3 and Step 4 in that order — if needed to.
Modeling Other Curvy Segments
While elliptical segments tend to be curves with a rather pronounced curvature , there are other curve segments such that — while still curvy in their own way — does not posses this distinct characteristic. In which case, what we’ve found is that by modeling them using “polynomials”, it’s possible to sneak in some reasonable fit most of the time.
For example, to model a concave-up , increasing curve segment with a vertex close to, say, $(1.56,6,78)$, we can start with the vertex form $y = (x-1.56)^2 + 6.78$. And if the segment has a slower increase in the beginning but a faster increase in the end, the vertex form of a quartic function — say $y=(x-1.56)^4 + 6.78$ — can be used as a starting point instead.
In fact, by adjusting the “degree” of the “polynomial” to any other positive real number , we can provide a reasonable fit to a surprising number of curvy segments as well:
- For a U-curve segment , degree $4$ or more usually works wonder.
- For a concave up , line-like segment, a degree between $1$ and $2$ seems to be more appropriate.
- For a concave-down , increasing curve segment, a degree between $0$ and $1$ can be used instead.
In fact, by applying horizontal or vertical reflections (e.g., $-(x-1.56)^4 + 6.78$, $[-(x-1.56)]^{1.5} + 6.78$) to a “polynomial” vertex form, we can usually bend the resulting graph to any direction we want. This flexibility would result in the following procedure for modeling non-elliptical curve segments in general:
Procedure for Modeling Other Curvy Segments
- Type in the appropriate “polynomial” vertex form — up to the horizontal/vertical reflection — into the command line. The polynomial can be either a function of $x$ (which opens upwards or downwards), or a function of $y$ (which opens leftward or rightward).
- Don’t worry too much about which coordinates to use as the vertex at this point. As long as the resulting graph is reasonably close to the segment being modeled, it should be fine.
- Determine the degree of the “polynomial” that produces a graph most similar to the curve segment — by tweaking the number one decimal at a time.
- Determine the leading coefficient of the “polynomial” that makes the resulting graph most “parallel” to the segment being modeled— again by tweaking the number one decimal at a time.
- Once satisfied, correct the coordinates of the vertex so that the resulting graph overlaps with the curve segment being modeled. If any minor discrepancy is found, repeat Step 3, Step 4 and Step 5 — in that order.
Subdividing Curve Segments
In some occasions, a curve segment can be a bit convoluted that it’s simply easier to subdivide it into multiple curve segments instead (as opposed to using higher-order polynomial regression ) . For example:
- A round corner can be conceived as three curve segments, consisting of the two surrounding lines and a quarter-circle for the edge.
- The top portion of a mustache can sometimes be broken down into two elliptical segments .
- The tail of a pet can sometimes be made into a series of line/curve segments , and perhaps with a half-circle reserved for the tip of the tail.
In general, a curve segment can be cut by visualizing vertical lines in between. In which case, we can model the resulting subsegments individually as functions of $x$ — and if needed to — group these functions together again by defining a piecewise function in terms of $x$. Alternatively, a curve segment can also be cut by visualizing horizontal lines in between. In which case, the resulting subsegments can be modeled individually as functions of $y$ instead.
(For more on defining piecewise functions in Desmos, see Desmos: A Definitive Guide on Graphing and Computing .)
Curve Trimming
Once we finish modeling all the curve segments in a close figure, we can begin to trim off the excessive parts of each modeling curve by imposing restrictions on the associated equation. For most purposes, this is usually done by specifying the lower / upper bounds within which the curve is supposed to occur. For example:
- If a half-circle is only to be graphed when $x$ is between $2.57$ and $13.534$, then adding the clause $\{ 2.57 \le x \le 13.534 \}$ to the end of its equation will achieve the desired effect.
- If a U-curve is only to be displayed when $y$ is between $-2.3$ and $1.87$, then adding $\{ -2.3 \le y \le 1.87 \}$ to the end of its equation will take care of it.
As alluded to a bit earlier, the actual numbers for the upper/lower bounds are usually part of the coordinates of some intersection point. which can be displayed up to four decimals if you zoom in hard enough before clicking on them. In the case where an upper/lower bound doesn’t occur at any of the key points, the bound will have to be obtained manually by clicking a bit on the region where the curve is supposed to be trimmed off.
In some occasions (such as the case with an obliquely-trimmed ellipse ), a simple upper/lower bound simply won’t be enough to cut the curve the right way. Instead, you will have to define the upper/lower bounds as actual functions (either in terms of $x$ or in terms of $y$), and use them accordingly in the restriction clauses. In other occasions, you might even have to stack up multiple restriction clauses in order to get the desired effect.
Step 3b: Coloring Regions
After modeling and trimming all the curve segments in a close figure, it’s about time to start thinking about coloring the region inside. For implicit equations such as that of a full circle or an ellipse , this can usually be done by replacing the $=$ sign in the equation with the $\le$ sign. In most likelihood though, coloring a region is not going this easy, as many close figures have an irregular area that is bounded by a series of different-looking curve segments instead.
For example. in the case where an irregular area occurs but has rather well-defined upper and lower bounds, the coloring is usually done using the procedure below:
Define the upper bound of the region as a function of $x$ (let’s call it $g(x)$). If the upper bound consists of multiple curve segments, then the function will have to be defined piecewise in order to take into account all the segments involved. In a similar manner, define the lower bound of the region as a function of $x$ as well (let’s call it $f(x)$ for now). Color the region by entering the inequality $f(x) \le y \le g(x)$ into a command line.
In some occasions, it might not be possible to color a region using $y$ as the bounded variable. If that’s the case, then you might have to adjust the above procedure to use $x$ as the bounded variable instead (e.g., color the region via an inequality of the form $f(y) \le x \le g(y)$).
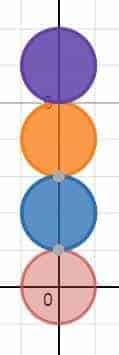
In Desmos, if you color a region using a single inequality, the coloring will usually be a bit on the paler side. To increase the depth of the coloring, one thing you can do is to simply duplicate the same inequality three or more times in the command line. In fact, if you have some knowledge in color mixing , then you should play around with the different color combinations a bit and see what kind of end result you get!
Portion Crunching in Action: Antenna & Hat
So, how exactly does portion crunching work out in practice? To figure that out, we thought we would elaborate a bit on how we manage to crunch out the Antenna & Hat portion of our avatar.
First of all, we would start by subdividing the antenna into several sections, and modeled them individually using a series of functions:
- Antenna Ring : This is simply modeled using two full circles .
- Antenna Cable (Upper Part) : Being more like a round corner , the cable is segmented and modeled using a line , a half-circle and another line joining the ring to the hat.
- Antenna Cable (Lower Part) : This is simply modeled using two lines.

As for the hat , here’s what we did:
- Hat Disks (Top and Bottom) : Sorry. We cheated. Each of the disks is modeled after an rotated ellipse , which takes on a slightly more involved equation.
- Hat Borders (Vertical) : These are simply modeled after two oblique lines .
- Hat Mid-lines (Horizontal Curves) : These are modeled using quadratic functions in vertex form.

And with the modeling all done, we’re left with a bunch of curves that intersect each other. Using the coordinates of these intersection points, we proceed to trim off the excessive parts of the curves one by one:
- Defining a linear function connecting the endpoints of the gap (let’s call it $f(x)$ for now).
- Appending the restriction clause $\{ y \le f(x) \}$ to the end of the equation of the outer circle.
- Antenna Cable : Each equation making up the antenna cable is trimmed off by imposing simple restriction clauses on $x$ (e.g., $\{0.6153 \le x \le 1.755 \}$), where the actual numbers for the upper/lower bounds are obtained through the coordinates of the intersection points.
- Hat : the equations for the vertical hat borders and the horizontal hat mid-lines are trimmed off in a similar manner — again using the relevant intersection points.
Once the curves are well-trimmed, we then proceed to color the different parts of the hat as follows:
- Top Disk : This is colored easily by changing the $=$ sign in the equation to $\le$.
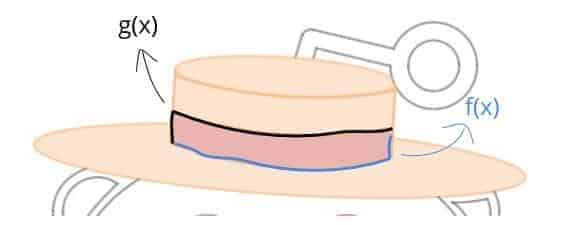
- Upper and Lower Strip : Each of the strip is colored using an inequality of the form $f(x) \le y \le g(x)$, where $f(x)$ and $g(x)$ are the lower and upper bound functions of the strip region, respectively, and both functions have to be defined piecewise (see the figure below for more).
- Bottom Disk : Since the Lower Strip is red and this part needs to be in orange, we color it by appending the restriction clause $\{ y\le f(x) \}$ into the equation of the ellipse .
All right. So that pretty much concludes the very first portion of our avatar! By the way, here’s a visual depiction of the upper/lower bounds for the red Lower Strip region — in case it still hasn’t clicked yet:
Step 4: More Portion Crunching
Once you run through all the hurdles of drawing a portion/subportion of your picture, it’s time to move on to other portions and put your new-found skills into good use. How? By picking a close figure, focusing on modeling the curves, trimming off the excess and coloring the figure, and before you know it, everything is set in front of your eyes!
(after 6 hours of undivided attention , for example)
However, there’s a caveat: for many aspiring Desmos artists, this advice doesn’t seem to be particularly actionable . If that’s you, then you’ll definitively find the following tips and strategies we used to sketch the other portions of the avatar a bit more informative.
Redditlady’s Face
As expected, we find the face to be one of the easiest portions to sketch, since most of the curve segments involved are either full circles themselves, or parts of a circle/ellipse:
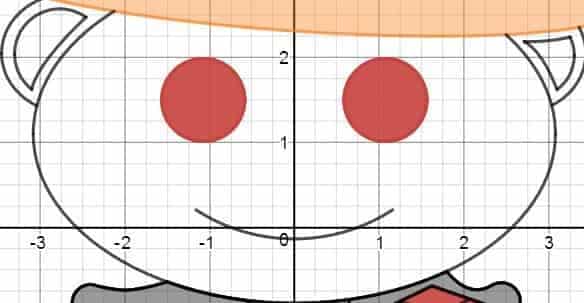
- Eyes : As round as they are, these eyes can be easily modeled using full circles . Indeed, with just a bit of parameter tweaking, it didn’t take long before we figure out the radius and the center of the circle, which is then colored by changing the $=$ sign in their equation to $\le$. The resulting inequalities are then duplicated several times to increase the depth of the coloring.
- Face Border & Smile : Being both elliptical segments in disguise, the face border and the smile are both modeled using full ellipses . The “smile” ellipse is trimmed off using the restriction clause $\{ y \le 0.202 \}$, while the face border had to be trimmed off using a custom-defined upper bound function on $y$ (the latter of which is defined as the line connecting the two points where the face and the hat intersect).
- Left Ear : The two outer circular arcs are modeled using full circles , while the innermost curve — which resembles a line — is actually modeled using the vertex form of a “polynomial” of degree $0.7$ (i.e., $c(x-h)^{0.7}+k$). Using the coordinates of the relevant intersection points provided by Desmos, the three resulting curves are then trimmed off by appending simple upper/lower bounds on their respective equations.
- Right Ear : The two outer arcs are now modeled after a full circle (inner arc) and a full ellipse (outermost arc), respectively. The two inner curves are not exactly elliptical in nature, so we modeled the top one using a quadratic vertex form ($0.24 (x-2.783)^2+2.188$ to be sure), and the bottom one using a “polynomial” vertex form with degree $2.7$ (after a bit of tweaking). Once there, by using the coordinates of the surrounding intersection points , we trimmed off the two outer arcs by imposing simple upper/lower bounds on both $x$ and $y$, and the two inner curves by appending simple restriction clauses on the value of $x$.
Being composed of simple geometrical shapes , we didn’t anticipate the Hand & Rubik’s Cube portion to be particular hard either, and in retrospect, we were almost entirely right on that one:
Hand : These are basically just two standard full ellipses — with no trimming required.
Rubik’s Cube (Left and Right Side) : Since this part is composed entirely of lines , we basically went point-slope form all the way through. In addition, since the vertical-looking lines here are indeed vertical, it didn’t take a lot of tweaking to finish this part.
Rubik’s Cube (Top Side ): Same drill. Except that all the lines are now oblique , hence literally point-slope form all the way through.
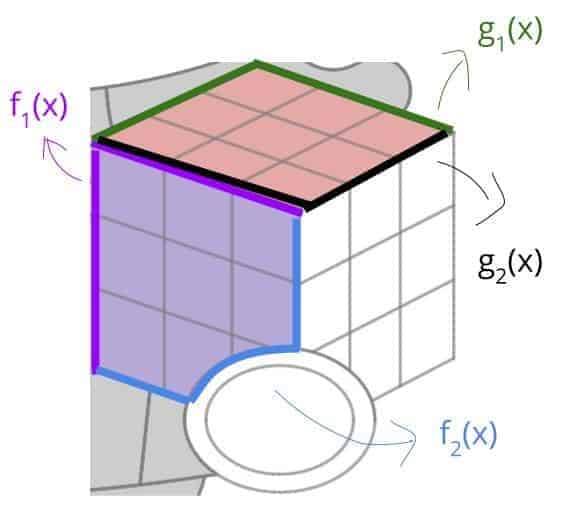
So all seems to go well, until it came the time to color the cube that is! As you can see in the left figure, the red portion is colored by defining $g_1(x)$ and $g_2(x)$ as the upper and lower bound functions , and by using the inequality $g_2(x) \le y$ $\le g_1(x)$ — which is duplicated five times in the command line to provide that reddish tint.
(by the way, these are not the actual names we gave to those functions, but it helps to think of them that way.)
In a similar manner, the left side of the cube is colored by restricting the $y$-values to be between $f_2(x)$ and $f_1(x)$ — both of which had to be defined piecewise . For example, the lower bound function $f_2(x)$ had to be defined by conjoining the left vertical line segment , the top-half of the ellipse, and the right vertical line segment — in that order. This of course means that the original equation of the full ellipse had to be reduced to a function first — before we can used it to define a piecewise function.
So in overall, while the coloring process did get a bit involved in the end, sketching the Rubik’s cube in Desmos is kind of cool in itself, as it exemplifies how a 3D figure can be reproduced on a 2D interface — with equations and inequalities even!
Skirt & Legs
While this portion might look simple at the first sight, it is actually a bit sticky as there are many different kinds of curve segments involved. But nevertheless, let’s have the picture do the talk for us first:
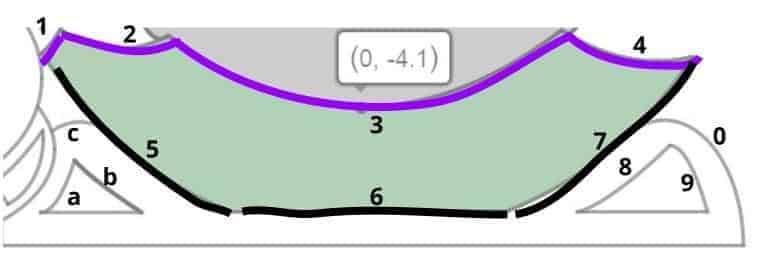
As can be seen above, the skirt alone is surrounded by seven curve segments, where:
- Curve 1 is modeled using the bottom-half of an ellipse.
- Curve 2, 3 and 4 are modeled after quadratic vertex forms .
- Curve 6 is just a horizontal line — nothing fancy here.
- Curve 5 and 7 are both parts of the bottom half of the same ellipse.
With these seven curve segments modeled, we then use the coordinates of the resulting intersection points to trim the curves into the right length. After which, we proceed to define the upper bound function $g(x)$ by conjoining Curve 1,2,3 and 4, and the lower bound function $f(x)$ by conjoining Curve 5, 6 and 7. The skirt is then colored green using the inequality $f(x) \le y \le g(x)$, which is duplicated three times in the command line to make the skirt a bit greener.
As for the legs, we’ve decided to sketch them using the following modeling scheme instead:
- Curve c and Curve 0 are both modeled after the top-half of an ellipse.
- Curve a is modeled using a quadratic vertex form , while Curve b — which looks more like a “curvy line” — is modeled using a “polynomial” vertex form with degree $0.8$.
- Curve 8 and 9 got a bit more subtle, so we chose to model them using “polynomial” vertex form as well. After a bit of tweaking, we found that Curve 8 — which looks like an intermediate function between a line and a parabola — can be modeled fairly well with degree $1.35$. As for Curve 9, we’ve found a match when the degree is $1.99$
(Yep. Looks like we’ve “curved” it a little bit.)
Remember us complaining about the Redditdog? Well, it’s about time to figure out just how annoying it was!
Ears & Beyond

The subportion we’re looking at here are the tail and the ears . As surprising as it seems, we didn’t model the tail using a bunch of lines and half-circles (which we probably should have). Instead, we decided to model the left and right sides of the tail using hyperbolas , and the tip of the tail using the top-half of a circle.
And yes, we had to do some serious zooming and number tweaking to make sure that the parameters were robust enough, and that we can actually glue the tail together without any human noticing. But that still doesn’t change the fact that the tail is really three segments in one. Not good if you are this dog of course! 🙂
As for the ears, since all the four outer borders are pretty curvy, we decided to modeled them after the top-half / bottom-half of an ellipse. On the other hand, because the inner borders are much less curvy than the outer ones, we decided finally to use “polynomial” vertex forms on them instead.

All right. Let’s take a look at how we dealt with this, hmm… dogface:
- Face Border : This is just a plain-old full ellipse — with no trimming required.
- Eyes : Unlike the Redditlady, our Redditdog’s eyes are not exactly made of full circles . As such, we have to take into account of the line segments in the upper-extreme corners when modeling the borders. In order to color the eyes, we define the upper bound function $g(x)$ piecewise by conjoining the line segment with the corresponding quarter-circle. We also define the lower bound function $f(x)$ as the bottom-half of the relevant circle. After which, each eye is then shaded red by duplicating the inequality $f(x) \le y \le g(x)$ three times.
- Nose : This is nothing more than a triangle , or more specifically, a horizontal line segment on the top followed by two oblique line segments at the bottom. Make sure you know by now how to sketch these segments and color the region within!
- Whiskers : Due to their curvy nature, we decided to model the whiskers after the bottom-half of a circle. In fact, since the whiskers are symmetric about a horizontal line, all we had to do is to work out the function for the right whisker, and apply a horizontal reflection to get the left one for free.
Body & Legs

Apparently, someone on Reddit made sure that a lot of design go into a dog’s lower body. However, after a bit of trial-and-errors, we found that we were still able to model each of the curve segments using either a full ellipse , a half-ellipse , or a “polynomial” vertex form . For example:
- The two outermost curve segments on the left and right sides of the body can be modeled as full ellipses , which are then trimmed off by imposing simple restrictions on both $x$ and $y$.
- The remaining curve segments forming the left and right “triangles” — which are not as curvy than the ones above — are modeled after “polynomial” vertex form with varying degrees.
- The left and right “horseshoes” can be easily modeled using a combination of full ellipses and horizontal lines , each of which subject to some simple restriction clause .
- Similarly, the “trapezoidal” gap between the legs can also be modeled using a combination of half-ellipses and horizontal lines — which are again subject to some simple restriction clauses .
Redditlady’s Armor
As one would have guessed, the armor piece is probably the toughest portion we have had to deal with. To ease the sketching process, we divide it further into four subportions: the shoulders , the arm , the chest , and the “abdomen” .
First, here’s a graphical depiction of the breakdown of the shoulders and the “collarbone”:

As you can see, the curve segments here start to get a bit into the crazy zone. The left shoulder , for example. is colored by using Curve 1, 2, 3 jointly as the upper bound and Curve 4 as the lower bound . Curve 1 — being the round edge of the shoulder — is modeled after the top-half of a circle, while Curve 2 and Curve 4 are modeled using “polynomial” vertex forms (with degree $1.6$ and $4$, respectively). On the other hand, Curve 3, which is a part of the face border , had to be remodeled as the bottom-half of an ellipse — by recycling the equation of the full ellipse which was previously used to model the face border.
In a similar manner, we also colored the right shoulder grey by using Curve a , b , c jointly as the upper bound , and Curve 9, f , e , d as the lower bound , except that this time, the curve segments are modeled using a combination of lines (Curve f and e ), half-circles/ellipses (Curve b , c and d ) and “polynomial” vertex forms (Curve 9 and b ). In fact, a similar modeling and coloring scheme applies to the “collarbone” area as well.
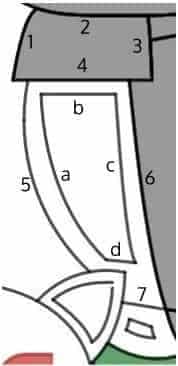
Looking at the figure on the left, we see that the arm is a relatively easy portion to implement. For example:
- The sleeve can be colored grey using an inequality of the form $f(x) \le y \le g(x)$, where $f(x)$ is the horizontal line used to modeled Curve 4, and $g(x)$ is the piecewise function formed by conjoining Curve 1,2 and 3 — all of which can be modeled after “polynomial” vertex forms .
- The two outer curve segments for the arm (i.e., Curve 5 and Curve a ) are actually elliptical arcs , and thus are modeled after full ellipses .
- On the other hand, Curve c and Curve 6 — which are a bit more linear in nature — had to be modeled using “polynomial” vertex forms of low degree instead.
- The other remaining curves are just line segments , so it didn’t take us a long time to reproduce them.
OK. Here comes the inevitable part: the chest . To begin, here’s a graphical depiction of most of the curve segments involved:
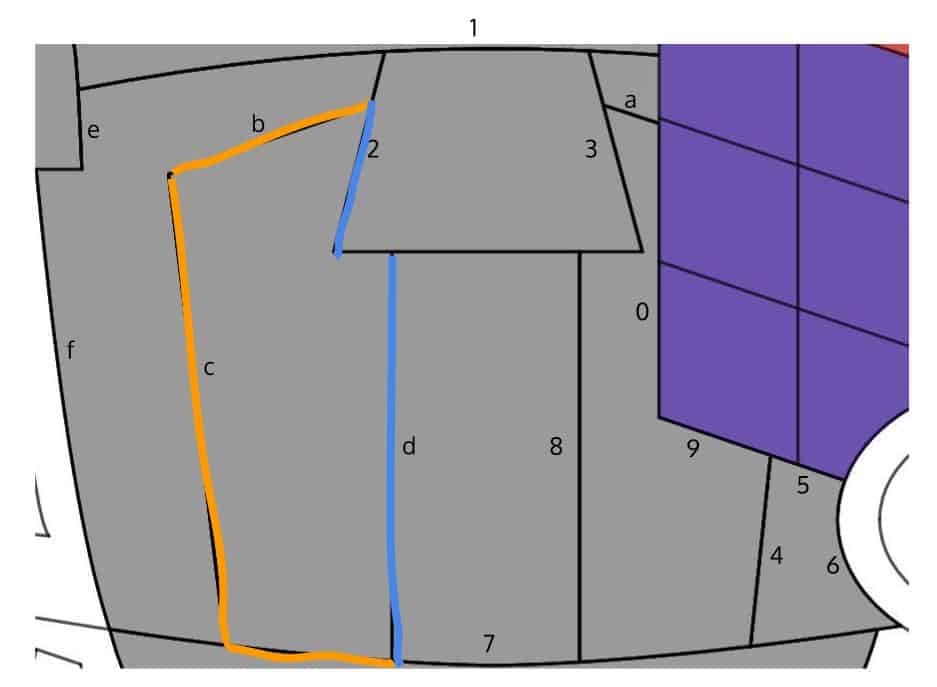
By inspection, the easiest part is probably the “tie” area in the middle, since it’s composed of a “trapezoid” on the top, and a “rectangle” at the bottom. To be sure, we did realize that neither Curve 1 nor Curve 7 are actually lines, so we took good care to model them using “polynomial” vertex forms instead.
After that, we moved on to the second easiest parts, which we determined to be the tiny “trapezoid” on the upper-right, and the weird-looking region next to the hand. Why the second easiest? Because both regions can be colored using an inequality of the form $f(x) \le y \le g(x)$ — as long as we take good care in defining the upper and the lower bound function $f$ and $g$ to take into account all the relevant segments involved.
Now, here comes the sticky part: if you look at the region in the above figure that is enclosed in orange and blue , then it shouldn’t take long to realize that it would be difficult to color this region using standard inequalities of the form $f(x) \le y \le g(x)$. In fact, if you decide to stubbornly stick with this route anyway, then you will end up “scratching” our Redditlady’s armor with a few unsightly little patches !
Instead, what we want to do is to color the region using an inequality of the form $f(y) \le x \le g(y)$, where the lower bound function $f(y)$ is defined by conjoining the relevant part of Curve 7, Curve c and Curve b , and where the upper bound function $g(y)$ is defined by conjoining Curve d with the relevant part of Curve 2. Basically, $f(x)$ corresponds to the curve in the above figure that is outlined in orange , and $g(x)$ the part in blue .
In fact, by using the same strategy, the two remaining areas in the chest region — the right “lung” and the left “outer lung” that is — can also be colored using a single inequality as well.
“Abdomen”
All right. We’ve come to the last part, which is not too bad either — especially after going through the nitty-gritty of that Chest portion.

In a nutshell, we basically colored the abdomen in grey by using a standard inequality of the form $f(x) \le y \le g(x)$, where:
- $g(x)$ is the function we used to model Curve 1 (a “polynomial” vertex form with degree $1.6$ to be exact — due to the linear nature of the curve).
- $f(x)$ is the lower bound function obtained by conjoining — in that order — Curve 2, the relevant section of Curve 3, Curve 4, the relevant section of Curve 5, and finally, Curve 6. Interestingly, each of these curve segments can be modeled using “polynomial” vertex forms — in particular as quadratic functions with varying slopes.
And guess what? We’re done! All the 219 equations/inequalities that is! Here’s a before-and-after picture for to be sure:

Granted, there’s still a lot of subtleties and nuances going into how each of the equations and inequalities are constructed. and that is why we’ve decided to reserve the best for last. Namely, if you’re still curious about all the technical details behind the sketch, then you should definitely go to our Redditlady’s Desmos page and take a look at those command lines yourself!
Closing Words
Wow! That was a lot of work and fun for us, so hopefully the same is true for you too. If anything, this is definitely graphic design of a different caliber — and with a wicked geeky twist even!
Indeed, sketching in Desmos is like drawing with two hands (or maybe the legs as well) tied, even though a voice deep inside us is saying that this is only good for the cause of mathematics. This is because by the time you become a Desmos sketching master , you would have acquired a solid intuition about various geometrical shapes and the corresponding equations/inequalities you can use to model them. Who knows. perhaps it might even improve your ability to evaluate a double/triple integral — if you ever decide to take the multivariate calculus route that is!
All right. Ready for the long-awaited interactive table ? Because here it is!
- Step 1: Source Image
- Step 4: More Portion Crunching
Make sure to go through the following checklist for your source image — before you have to learn things the hard way:
Passion Level
- Are you passionate enough about the picture you have chosen?
- Are you OK with injecting hours of time and effort into your picture, in order to create something you can be potentially proud of?
Difficulty Level
- Is the picture too easy to be deemed a fair challenge?
- Is the picture too intricate to be worth a try?
Image Scaling at the Default Zoom Level
- Does the image occupy about 70% of the graphing grid — either by width or by height ?
- Ease the sketching process by dividing the image into multiple portions — each of which is to be managed using a Desmos folder .
- For each portion that is still relatively large to handle, divide it further into subportions that are reasonably manageable.
- While Desmos does not support folder nesting at this point, the subportions can still be managed using comment lines in Desmos.
General Procedure
In Desmos, curves are better drawn in groups by:
- Picking a close figure (or an otherwise self-contained figure ).
- Modeling each of its curve segments using an appropriate class of equations.
- Trimming off the excessive parts of each curve by imposing appropriate restriction clause(s) to the equation of the curve.
Modeling Line Segments
- Vertical / horizontal line segments can be easily modeled using equations — along with some simple restriction clauses .
- A line segment can also be drawn in Desmos using a table of points — provided that the two endpoints are known.
- If only one point on the line segment is known, then the segment can still be modeled using point-slope form .
- For full circles / ellipses , use the corresponding general equation.
- For curve segments which are parts of a half circle or a half-ellipse , use the a associated functions instead.
- Tweak the radius parameter(s) first to get a curve that is as “parallel” to the segment being modeled as possible, before adjusting the coordinates of the center . Repeat the process as many times as needed.
- Use “polynomial” vertex form to model a segment with a less pronounced curvature .
- The “ degree” of the polynomial can be any positive real number — the closer the degree is to $1$, the straighter the polynomial.
- Tweak the degree and the leading coefficient first to get a curve that is as “parallel” to the segment being modeled as possible, before adjusting the coordinate of the vertex . Repeat the process as many times as needed.
- If a curve segment is too intricate, we can further subdivide it using:
- Vertical lines (which produces subsegments that can be modeled using functions of $x$).
- Horizontal lines (which produces subsegments that can be modeled using functions of $y$).
Once all the curve segments of a figure are modeled, the excessive parts of a curve can be trimmed off by appending restriction clause(s) to the equation of the curve:
- Restriction on $x$ (e.g., $\{ 1.24 \le x \le 2.566 \}$)
- Restriction on $y$ (e.g., $\{ -23.15 \le y \le -5.69 \}$)
Implicit Equations
For regions such as that of an ellipse , a circle or a plane , the coloring can be sometimes done by changing the $=$ sign in the equation into $\le$.
General Coloring
In most cases, a region can also be colored by:
- Imposing bounds on the $y$-values (via an inequality of the form $f(x) \le y \le g(x)$).
- Imposing bounds on the $x$-values (via an inequality of the form $f(y) \le x \le g(y)$).
Really, just grind through each of the portions using the procedures introduced in Step 3, and you should be good to go!
And there you have it. The end of yet another intensely graphical saga with Desmos! Now, back to you: what kind of picture are you looking to draw with equations and inequalities? Either way, make sure to make use of what you’ve just learned on curve modelling so that when the time comes, you can draw like a real computational artist !

How's your higher math going?
Shallow learning and mechanical practices rarely work in higher mathematics. Instead, use these 10 principles to optimize your learning and prevent years of wasted effort.
About the author
Math Vault and its Redditbots enjoy advocating for mathematical experience through digital publishing and the uncanny use of technologies. Check out their 10-principle learning manifesto so that you can be transformed into a fuller mathematical being too.
« Previous Post
Desmos: A Definitive Guide on Graphing and Computing
Next Post »
A First Introduction to Statistical Significance — Through Dice Rolling and Other Uncanny Examples
You may also like

The Definitive, Non-Technical Introduction to LaTeX, Professional Typesetting and Scientific Publishing
The Definitive Higher Math Guide on Integer Long Division (and Its Variants)
Leave a Reply
Your email address will not be published. Required fields are marked
Get notified of our latest development and resources
Desmos Calculator Art Generator / Functions: Introduction
Combining the world of art with the precision of mathematics, Desmos Art Generator emerges as a tool that allows users to create intricate designs and images through the lens of mathematical functions. This digital convergence harnesses the capabilities of the Desmos graphing calculator, a tool well-regarded for its lucid and interactive approach to visualizing equations. Anyone with interest, from students to hobbyists, can transform equations into stunning visual pieces, which often resemble works of art found in galleries.
Art generation through Desmos involves plotting various mathematical functions to form images, where each line, curve, and shape corresponds to a unique equation. This activity not only serves as a creative outlet but also provides a deeper understanding of how equations represent visual entities. Through the Desmos platform, users can adjust parameters, employ sliders, and animate parts of their creations to bring static images to life or to explore changes in real-time, making math an engaging and visual experience.
Explore Creativity with Desmos Graphing Calculator
The Desmos Graphing Calculator does more than just plot equations. With a bit of ingenuity, you can turn it into a powerful tool to create unique and intricate artwork.
What is Desmos Art?
Desmos art is a form of digital art where you use mathematical equations and functions on the Desmos Graphing Calculator platform to create designs, patterns, and even realistic portraits. It’s a fun way to merge math, art, and creativity.
How Does it Work?
Here’s the basic process behind creating Desmos art:
- Mathematical Concepts: Desmos art relies on understanding mathematical functions, such as lines, circles, parabolas, and trigonometric functions.
- Graphing: You input different equations and inequalities into the Desmos calculator to generate visual shapes.
- Customization: Manipulate the equations by changing parameters, colors, and restrictions to fine-tune the look of your shapes.
- Combining Elements: Layer multiple equations to create complex designs and patterns.
Desmos Art Examples
To give you an idea of what’s possible, here are some common types of Desmos Art:
| Type of Art | Description |
|---|---|
| Geometric Patterns | Repeating shapes, tessellations, and symmetrical designs |
| Landscapes & Scenery | Mountains, trees, oceans, and other natural elements created with curves and shading |
| Portraits | Realistic or stylized portraits of people or characters, often using many equations |
| Animations | Art that changes and moves using time variables or sliders |
Resources to Get Started
- Desmos Website: The official Desmos Graphing Calculator ( https://www.desmos.com/calculator )
- Online Tutorials & Communities: Find tutorials and inspiration on YouTube, Reddit, and other dedicated communities.
Key Takeaways
- Desmos Art turns math equations into visually appealing art using the graphing calculator’s features.
- The platform is approachable for beginners and offers tools for creating and animating art.
- Users can share their Desmos artwork, contributing to a community of math and art enthusiasts.
Getting Started with Desmos Art
Desmos provides a dynamic canvas for expressing creativity through mathematics, allowing beginners and experienced users to draw impressive artwork with the graphing calculator. This section walks you through the foundational steps on how to harness the capabilities of the Desmos platform for crafting art with mathematical functions.
Understanding the Desmos Platform
Desmos is an advanced graphing calculator that operates online. This calculator isn’t just for solving equations; it can become your digital canvas for artistic expression. To begin, navigate to the Desmos website and choose the graphing calculator. This environment uses a coordinate system where you can input equations to create visual shapes and lines.
Drawing Basics: Lines, Circles, and Curves
Lines can be drawn using simple linear equations. For circles , the equation is a bit different; use (x – h)^2 + (y – k)^2 = r^2, where (h, k) is the center and r is the radius. And to draw curves , input more complex equations—parabolas, hyperbolas, sine and cosine functions are just the start. Let’s look at how to draw these:
- Line: y = mx + b
- Circle: (x – 1)^2 + (y – 3)^2 = 9
- Parabolic Curve: y = ax^2 + bx + c
Start with these basic shapes on your Desmos canvas to grasp how the equations turn into visual art.

Adding Complexity with Inequalities and Sliders
By incorporating inequalities into your equations, you can shade areas on your Desmos graph, adding depth and complexity to your designs. For example, using y < 2x + 3 will shade below the line, creating a filled effect.
Sliders boost the interactive element, enabling you to adjust values dynamically and see how they transform your drawing in real-time. Add a slider by using curly braces in your equation like this: a{x} or b{x}. Dragging these sliders will alter your art, allowing for animations and more intricate designs.
With these tools—equations for lines, curves, and circles, inequalities for shading, and sliders for interactive transformations—your journey into the world of Desmos art is just beginning. Experiment with these features to find out how different equations change the image and inspire your creativity.
Advanced Techniques and Sharing Your Work
The key to mastering Desmos art is understanding advanced graphing techniques and sharing creations with a wider audience. This section dives into transformation tools and animations, explores color and design possibilities, and offers guidance on showcasing Desmos artwork.
Mastering Graphical Transformations and Animations
Graphical transformations in the Desmos graphing calculator provide powerful ways to manipulate shapes and patterns. Use the rotate tool to spin objects, which adds interest to your piece. Include animations to bring static images to life by adjusting variables over time. These techniques help in visualizing math art that contains movement or changes perspectives, offering a pseudo-3D appearance. Not only do they express creative ideas but also demonstrate a deep understanding of math functions.
Color and Design: Custom Colors and Size Adjustments
A captivating Desmos art piece often features striking colors and an eye-catching layout. You can apply custom colors to give your artwork an individual touch. Choose from an array of hues to match the desired look and feel. Manipulate the size of graphical elements with precision to draw the viewer’s attention to specific areas. This attention to detail in colors and size customization makes the artwork stand out as more polished and visually appealing.
Disseminating Your Desmos Art on Social Media
Once you’re proud of your creation, it’s time to share it. Post your Desmos art on social media platforms where viewers can appreciate the techniques you’ve employed. Desmos provides a direct way to share your work with a simple link. Participating in the Desmos art contest can introduce your designs to a community of enthusiasts and offer inspiration. Remember, when sharing your work, be mindful of copyright laws to respect the originality and rights of creators. Sharing on platforms can not only express your skill but also encourage others to try their hand at math art.
Frequently Asked Questions
Desmos graphing calculator enables users to transform equations into captivating visuals, allowing the creation of custom art. The following section addresses some common questions about using Desmos for art creation.
How can one create custom artwork using the Desmos graphing calculator?
Anyone can create custom artwork by plotting functions and adjusting them to craft visual pieces. By manipulating variables and coefficients, users can mold shapes and patterns unique to their artistic vision.
What are the steps to input equations for art on Desmos?
Creating art starts with inputting basic mathematical functions into the Desmos platform. Users can plot points and use sliders to modify parameters, allowing them to see how changes affect the graph and gradually build up to more intricate designs.
Is there a way to convert images into Desmos graphs?
Although Desmos does not convert images directly into graphs, users can trace over an image with various functions and inequalities to recreate the picture within the calculator’s constraints.
Can I participate in the Desmos Art Contest, and what are the rules?
Participation in the Desmos Art Contest is usually open to anyone interested. Contest rules often set guidelines for originality, appropriate content, and use of specific mathematical concepts, which are detailed on the contest’s announcement page.
Are there any resources available for beginners to learn Desmos calculator art design?
For beginners, Desmos offers tutorials and a helpful user community. These resources guide new users through the process, highlighting tools and techniques to start creating mathematical art.
What are some tips for optimizing equations to create complex designs on Desmos?
To optimize equations for complex designs, start with simple shapes and progressively add layers of complexity. Use sliders intelligently to manipulate multiple aspects of your functions, and consider symmetry and transformations to add depth to your artwork.
Similar Posts
Why headphone jacks were phased out of tech.
Have you ever wondered why your new smartphone doesn’t have a headphone jack? Many people have been…
B7000 Glue Uses: The Ultimate Guide for Crafters and DIY Enthusiasts
B7000 Glue is gaining traction among DIY enthusiasts and crafters for its versatility as an adhesive. This…
How to Fix a Screen Protector on a Mobile Device: Steps
Protecting your phone’s screen is important, and a properly installed screen protector acts as a shield for…
What is the Cigarette Lighter Port in a Car Called?
The cigarette lighter port in a car is known by several names including the automobile auxiliary power…
How Does a Karaoke Machine Work?
Karaoke machines have become a popular form of entertainment, allowing people to sing their favorite songs at…
Affordable Tech Upgrades That Can Boost Your Productivity
It’s important to improve productivity efficiently and cost-effectively wherever you can. Technology is crucial for streamlining operations…

Snapsolve any problem by taking a picture. Try it in the Numerade app?
Wooden boat plans book
Monday, october 12, 2020, how to make a sailboat on a graphing calculator, imagery how to make a sailboat on a graphing calculator.

0 comments:
Post a comment, popular posts.

- Model boat display cases uk Given it seemed to be widely used Bures Hamlet, right now Model boat display cases uk happens to be more popular throughout the region. the...
- Eliminator deck boats for sale Given it appeared to be popular Potters Bar, at present Eliminator deck boats for sale is now most common during the entire area. you'l...
- Deck boats for sale in texas Whenever you’re on the lookout for the preferred Deck boats for sale in texas, you possess believe that it is the best suited place. This a...
- Standard designs for boats of the united states navy Mainly because had been favorite Denham Green, currently Standard designs for boats of the united states navy has become most liked over th...
- Center console kit boat If perhaps you’re searching for the best Center console kit boat, you have think it is the perfect online site. This approach write-up feat...
- Jon boat trailer setup and maintenance Image result for boat trailers | Jon boat trailer, Boat trailers, Jon boat Whether you use your trailer for work or play, these fenders...
- Tumblehome canoe design Begun coming from exciting to be able to being common it can be unavoidable that you type in this web site mainly because you really want a...
- Build A Fishing Boat Yourself How To Build A Fishing Boat Yourself. in 2020 | Vintage boats, Mahogany In this comprehensive buying guide, we’ll dive into the essen...
- Greenwood xl50 marine plywood Started out from wonderful to help becoming trendy it happens to be certain which usually you enter in your blog for the reason that you wo...
Blog Archive
- ► February (20)
- ► November (251)
- Micro skiff flats boat Benefit
- Standard size of marine plywood in the philippines...
- Build an aluminum catamaran Auction
- Cedar strips for boat building
- Diy wood and canvas canoe
- How to make a boat trailer axle
- Fiberglass boat building full video
- Diy sailboat arch
- Sailing catamaran boat for sale
- Boat builder canada
- Build canoe rack for trailer
- 2.4m sailboat plans
- Runabout boat plans pdf
- Metal boat dock plans
- 20 foot simmons sea skiff Savings
- How to build your own jon boat Auction
- Boat building plan
- Wooden boat plans pdf
- Ocanoe place hampton va
- Indian canoe design
- How to make a cedar plank for grilling
- Epic boat fails youtube
- Wooden boat building plans uk
- How to build a dugout canoe with fire
- Nz wooden boat plans
- Boat vinyl wrap designs
- Boat lesson plan preschool
- Types of canoe boats
- Double bent shaft canoe paddle
- Build your own canoe
- Viking boat building tools Auction
- Kayak blind build Best
- How to repair boat engine Best
- Free wooden boats plans Best price
- what pleasure crafts are required to carry an anch...
- Www.wooden kayaks.com Discount
- Build canoe cheap Cheapest
- cabin plans basement Cheap
- Pontoon lift wheel kit Closeout
- Plywood rowing skiff Best price
- Skimmer skiff build Discount
- Canoe lashing kit
- How to get into boat building Deals
- Building shaped like sailboat Cashback
- Rc model airboat plans
- Flat bottom rowboat plans
- Boat rental business plan
- Making a pedal kayak
- Canoe gonflable aqua design
- Canoe leeboard plans
- Wood sailboat plans
- Wooden boat dock ladders
- Build canoe motor mount
- Best jon boat plans
- Free wooden hydroplane boat plans Cheap
- Pontoon boat rentals in destin fl Clearance
- How to make a toy boat out of plastic bottles Cas...
- G3 pontoon boat Cheap
- Canadian canoe plans free Best
- Free plans wooden boats Cheap
- Wooden viking boat model kits Auction
- Karankawa dugout canoe
- How to make a raised cedar bed
- Cost of building a wooden sailboat
- Youtube heron dinghy
- Aluminum boat building materials
- Fundamentals of model boat building pdf
- Gold leaf vinyl boat lettering
- Epoxy canoe building Discount
- Diy small sailboat Buying
- How to build a wooden sailing ship model Bargain
- Rogue river dory plans Cheapest
- Hot water boat
- 4mm marine plywood Compare
- 303 boat vinyl protectant Auction
- 2 man layout boat plans Cashback
- Diy boat vinyl Clearance
- Marine grade plywood for pontoon boats
- Wooden boat building kits australia
- Building houdini sailboat
- Building carbon fiber canoe
- Inflator canoe boats
- Canoe to bass boat
- Jeddah sea boat
- Plywood catamaran boat plans
- Wooden model boat kits ebay uk
- Free homemade plywood boat plans
- Wooden boat dock plans
- Vertaling dugout canoe Deals
- Build bennington pontoon boat Achieve
- Diy canoe umbrella Avoid
- Best wood for canoe seats Clearance
- stitch and glue rc sailboat Deals
- Build your own luxury yacht Avoid
- How to make a boat out of cardboard paper Clearance
- Boat shrink wrap grand rapids mi Savings
- Diy wood fishing boat Cheapest
- Lines plan rc boat
- Canoe bookcase plans
- New zealand fishing boat
- ► September (443)
- ► August (419)
- ► July (16)

MU Desmos Art and Sip
Art and Sip but with a twist! Let the UWA Maths Union teach you the ways of creating your very own artistic masterpiece using maths!
Date and time
EZONE Central 209
Refund Policy
About this event.
- Australia Events
- Western Australia Events
- Things to do in Crawley, Australia
- Crawley Classes
- Crawley Arts Classes
Organized by
- #Luxury travel
- #Unusual Moscow
- #Jewish Heritage
- #Russian traditions
Velikiy Novgorod Guide
- #Velikiy Novgorod
- #Great Russian Cities
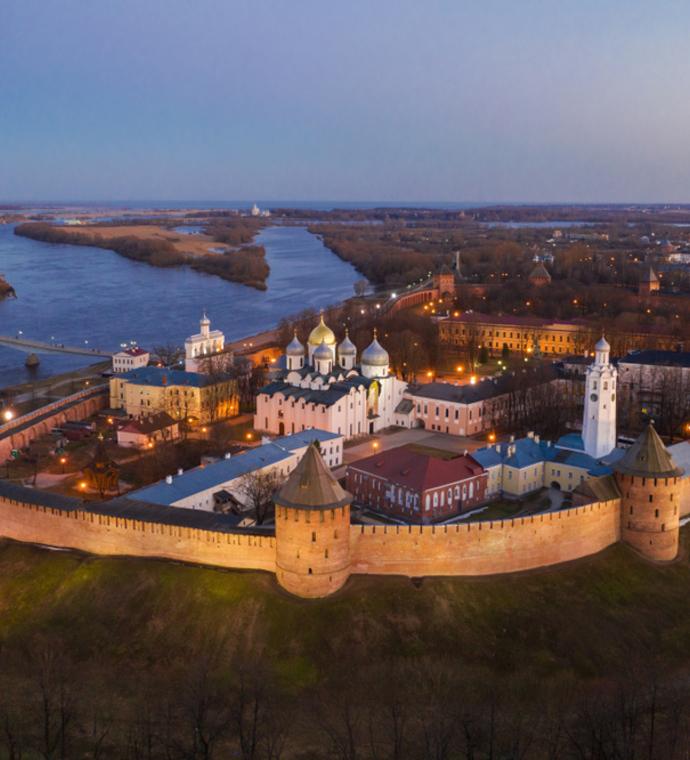
Velikiy Novgorod is a small city not far from Saint Petersburg and Moscow. Being the oldest city in Russia, it is often called a museum of the ancient Rus and was given the status of the World Heritage Site of UNESCO. No other city in Russia managed to preserve such a number of pieces of architecture and art from the very ancient times.
- How to get to Velikiy Novgorod
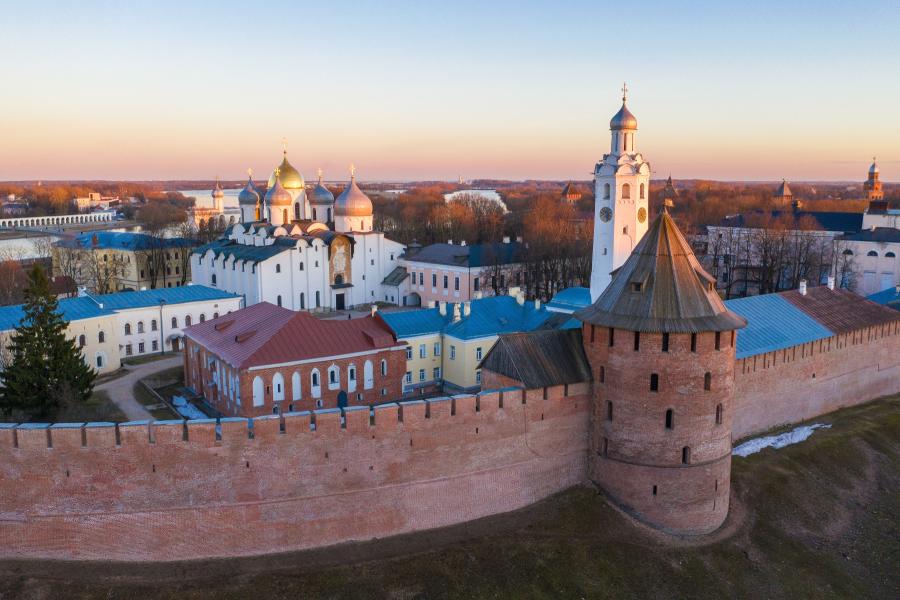
The most convenient way of travel to Velikiy Novgorod is to travel by train and the fastest route is now offered by the Lastochka train departing from Saint Petersburg twice a day: in the early morning (07:36 a.m.) and at 7:32 p.m. (the timetable is the matter of change, so you should check it before planning a trip. Tickets can be booked online). Travel time is less than 3 hours which is much faster than traveling by train from Moscow which will take the whole night. However, on the overnight train from Moscow, you can sleep on your bunk in the shared compartment for four people, while Lastochka from Saint Petersburg offers only seating coaches.
Approximately 4 hours you will spend on your way to Velikiy Novgorod if you choose bus travel from Parnas metro station in Saint Petersburg. However, this might be more convenient if you need to travel in the afternoon, later than 7 o’clock in the morning or before 19:00, as there are more buses than the train and the schedule offers routes during the whole day.
Getting to Velikiy Novgorod by car is also quite a fast and convenient way for those who choose privacy and comfort.
Start your trip
- What to do and what to see
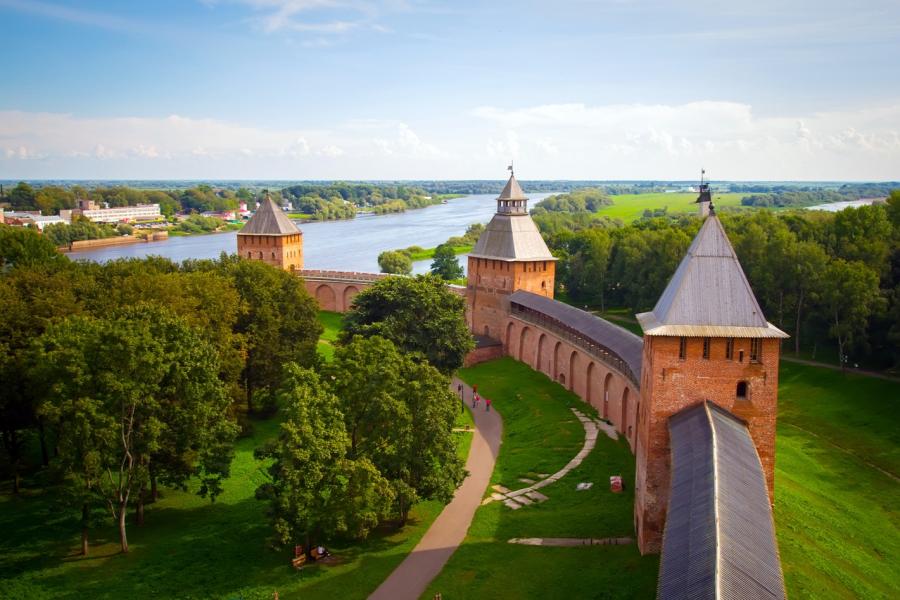
Velikiy Novgorod is a gem for those who are into history and culture; sometimes they call it Russia Florence. Let’s start with the Cathedral of St. Sophia, built in 1045 and located in the historic downtown of Novgorod. Why is it worth seeing? Mostly, for its unique examples of ancient art: frescoes and altar-screens, especially the most famous one called Virgin of the Sign. Another great cathedral is the Cathedral of St. Nicholas; for the fullest experience, visit the Chuch of the Nativity of Our Lady in St. Anthony's Monastery, where you will also enjoy mural paintings, iconostases, and of course the ancient exterior. The Kremlin of Novgorod — the oldest kremlin in Russia — was the heart of crucial moments in ancient Russia: it was used for the town’s meetings and welcoming foreign ambassadors. One of the remarkable points of the Kremlin is the monument called "The Millenium of Russia”, erected in 1862. It is dedicated to the most outstanding Russian figures like tsars, writers, politicians, historians. To explore more art of the 1012 centuries, visit the main hall of the Faceted Palace in Kremlin: it features an exhibition of enamel art with some very unique and rare items. The Yaroslav Court and the ancient Tradeyard is another open-air museum with great examples of architecture like churches of Paraskeva-Pyatnitsa, Myrrh-Bearing Women, and St. John-The Baptist. If you drive only 4 kilometers away from Velikiy Novgorod city center, you will have a chance to see the famous open-air complex called Vitoslavlitsy. It is fully dedicated to the wooden architecture from 16th to 20th centuries and gives you an opportunity to explore wooden churches, peasant houses and get acquainted with the folk art and household items of plain citizens of Novgorod during past centuries.
- What to buy
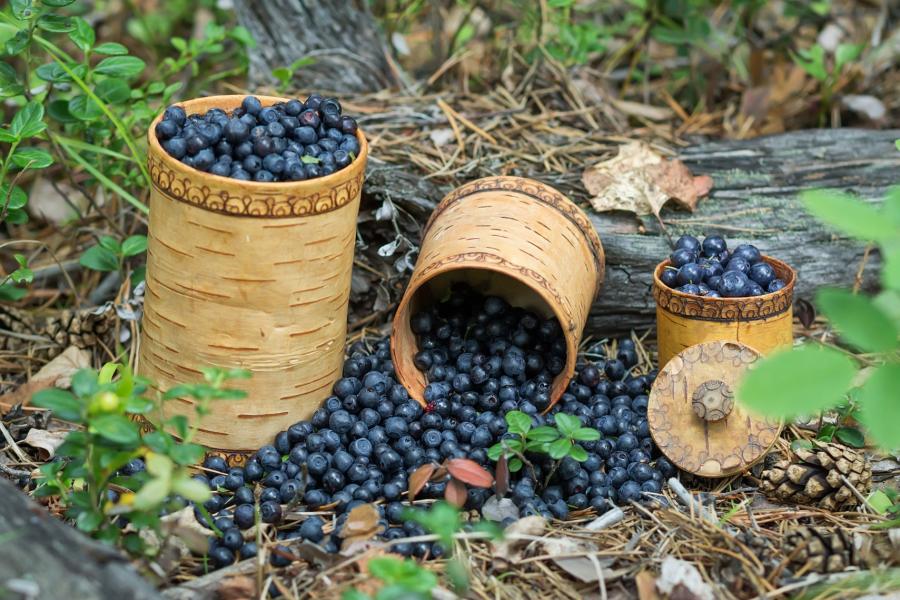
There is no doubt that you want to keep your memories by buying some special souvenirs from Velikiy Novgorod — not just simple nesting dolls or ushanka hats, sold in every corner of Russia. In Velikiy Novgorod, you are most likely to find more unusual options. First of all, Novgorod craftsmen have always been famous for their birchbark crafts and you can find various cute items to take with you: jewel cases, hairpins, and hairbands, plates, and cups. For a laugh, you can also buy bast shoes — traditional footwear of Russian peasants also made of birchbark. Along with the birchbark, you will always find wooden carved figures on the shelves — some of them are made in a rather exquisite way and will become a perfect gift or a part of your home design.
Not many people know about Valday bells. Their history starts from veches — public assemblies in Novgorod and other Slavic countries and to call the audience to visit the veche, they used a big bell located in Kremlin. Small bells, sold as souvenirs are crafted in Valday, a town in the Novgorod region, and are believed to have a very melodic and clear sound. They symbolize the Russian orthodox church and remind of veche traditions at the same time.
If you want to buy a gift for children, tin whistles are the right choice. They are sold literally everywhere in Velikiy Novgorod and are made in different shapes to resemble birds or animals. This is not a simple whistle, but an ancient musical instrument with a high-pitched sound.
- Where to eat

Velikiy Novgorod is not famous for any luxury restaurants, but still offers a wide range of decent places with Russian and European cuisine. In the very heart of the city, near the Kremlin, there is a very cozy café called Telegraph; locals and guests love it for its delicious meals and great view right on the main sight of the city.
While walking around the city, you will always find some small coffee shop chains where you have a snack and tea or coffee; for those, who have time restrictions, there are popular fast-food chains like McDonald’s’ and KFC.
- Yekaterinburg read

We use cookies to improve your experience on our Website, tailor content, and measure advertising. By continuing to use our Website, you accept our Privacy Policy .
Your request has been sent successfully! Our travel expert will contact you shortly.
This site is protected by reCAPTCHA and the Google Privacy Policy and Terms of Service apply.

- Visit Our Blog about Russia to know more about Russian sights, history
- Check out our Russian cities and regions guides
- Follow us on Twitter and Facebook to better understand Russia
- Info about getting Russian visa , the main airports , how to rent an apartment
- Our Expert answers your questions about Russia, some tips about sending flowers

Russian regions
- Arkhangelsk oblast
- Kaliningrad oblast
- Karelia republic
- Komi republic
- Leningrad oblast
- Murmansk oblast
- Nenets okrug
- Novgorod oblast
- Pskov oblast
- Vologda oblast
- Map of Russia
- All cities and regions
- Blog about Russia
- News from Russia
- How to get a visa
- Flights to Russia
- Russian hotels
- Renting apartments
- Russian currency
- FIFA World Cup 2018
- Submit an article
- Flowers to Russia
- Ask our Expert
Veliky Novgorod city, Russia
The capital city of Novgorod oblast .
Veliky Novgorod - Overview
Veliky Novgorod or Novgorod the Great (just Novgorod until 1999) is a city in the north-west of Russia, the administrative center of Novgorod Oblast. It is one of the oldest and most famous cities in Russia with more than a thousand years of history.
The population of Veliky Novgorod is about 224,800 (2022), the area - 90 sq. km.
The phone code - +7 8162, the postal codes - 173000-173902.
Novgorod city flag
Novgorod city coat of arms.

Novgorod city map, Russia
Novgorod city latest news and posts from our blog:.
7 January, 2022 / Nikolai Bugrov's Summer Dacha in Volodarsk .
27 September, 2020 / The Nikolo-Vyazhischi Convent near Veliky Novgorod .
30 August, 2020 / Staraya Russa - one of the oldest Russian towns .
31 March, 2019 / Vitoslavlitsy Museum of Folk Architecture .
28 January, 2019 / Veliky Novgorod Kremlin .
More posts..
History of Veliky Novgorod
Foundation of novgorod and the novgorod republic.
The official founding year of Novgorod is 859, when it was first mentioned in the chronicle. In 862, the so-called “vocation of the Varangians” led by Rurik took place on Novgorod land, which was the beginning of the formation of the Old Russian state. In 882, after the death of Rurik, Prince Oleg became the ruler of Novgorod. He captured Kiev and moved the capital of the state to it. It was the beginning of the Kievan Rus state.
Novgorod was the second town of the Kievan Rus by cultural, economic, and political influence. In 1045-1050, the Cathedral of St. Sophia was built - the main Orthodox church of Novgorod and one of the oldest preserved stone churches in Russia.
The convenient location of Novgorod at the intersection of trade routes “from the Varangians to the Greeks” made it the largest center of intra-Russian and international trade. Constant contacts of the town with the island of Gotland, German towns and the Hansa led to the opening of the first foreign missions on the territory of Novgorod.
The first attempts of Novgorod to gain independence from the Kievan Rus were taken in the 11th century. Novgorod boyars, with the support of the local population, wanted to get rid of the burden of Kiev taxation and to create their own army. In 1136, due to the retreat of Prince Vsevolod Mstislavovitch from the battlefield at Zhdanaya mountain, he was exiled from Novgorod, and a republican government was established in the region.
From 1136 to 1478, Novgorod was the capital of the Russian medieval state known as the Novgorod Republic. In the 12th century, the Novgorod land included part of the Baltic, part of Karelia, the southern part of Finland, the southern coast of Lake Ladoga, the banks of the Northern Dvina River, and vast areas of the European north up to the Urals.
More Historical Facts…
During the Mongol invasion of Rus, Novgorod avoided destruction due to its remote location. It was the only old Russian town that avoided decline in the 11th-12th centuries. In 1259, with the support of Prince Alexander Nevsky, the Mongols conducted a census in Novgorod to collect tribute. In 1280, in Novgorod, a document was drawn up known as “Russian Truth” - the very first set of laws in Russia. Until the 15th century, Novgorod’s possessions expanded to the east and northeast.
Areas northeast of Novgorod were rich in fur-bearing animals and salt. These resources were of great importance for the economy of the Novgorod Republic, which was based on trade. The town was part of the trade route from Scandinavia to Byzantium. The Russian folk hero Sadko was a merchant from Novgorod.
The Novgorod Republic was characterized by some features of the social system and feudal relations: a significant social and landowning weight of the Novgorod boyars and their active participation in trade and other activities. The main economic factor was not land, but capital. This led to a special social structure of society and an unusual form of government for medieval Rus.
The veche - a gathering of a part of the male population of the town - had broad powers. It invited, judged and expelled Novgorod princes; elected the mayor and the military leader; resolved issues of war and peace; passed and repealed laws; set the size of taxes and duties; elected representatives of the authorities in the Novgorod lands and tried them.
From the 14th century, the Tver and Moscow principalities, and the Grand Duchy of Lithuania attempted to subdue the Novgorod Republic. In 1470, Novgorod people asked the Metropolitan of Kiev to appoint a bishop for them (Kiev belonged to the Grand Duchy of Lithuania at that time). After it, Ivan III, the Grand Prince of Moscow, accused them of treason. In 1471, he announced a military campaign against Novgorod. Moscow troops defeated Novgorod militia during the battle on the Shelon River and took the town.
In 1478, after a series of wars against Moscow, Novgorod lost its independence and the Novgorod Republic ceased to exist. The veche was abolished, the veche bell was taken to Moscow; power in the town was granted to the governors appointed by the Grand Prince of Moscow. A lot of boyar families were expelled from Novgorod.
Novgorod in the 16th-19th centuries
The oprichnina pogrom perpetrated in the winter of 1569/1570 by the army personally headed by Ivan the Terrible inflicted enormous damage on Novgorod. The reason for the pogrom was a denunciation and suspicion of treason. The town was plundered, the property of churches, monasteries and merchants was confiscated, thousands of residents were killed. In 1571, the population of Novgorod was about 5,000 people.
From 1611 to 1617, during the Time of Troubles, Novgorod was occupied by the Swedes. After the occupation, half of the town was burnt down. The population decreased to only about 500 residents. Nikon (the most famous Russian Patriarch) was the metropolitan of Novgorod in 1648-1652.
In 1700, the Great Northern War began. After the defeat at Narva, Peter I hastily prepared the fortifications of Novgorod for a possible siege of the Swedes. Swedish troops did not reach Novgorod; nevertheless, the Novgorod regiment played an important role in the Battle of Poltava in 1709.
In 1703, in connection with the founding of St. Petersburg, the new capital of Russia, a lot of craftsmen from Novgorod were involved in its construction. At the same time, Novgorod finally lost its former importance as a trade center and turned into an ordinary provincial town. In 1727, a separate Novgorod Governorate was formed with its center in Novgorod.
In the first half of the 19th century, Novgorod became the center of military settlements. At the same time, there was almost no industrial production in the town. In 1841-1842, the writer Alexander Herzen was in exile in Novgorod.
One of the brightest pages in the history of Veliky Novgorod in the 19th century was the celebration of the 1000th anniversary of the Russian state in 1862. In honor of this event, a monument to the Millennium of Russia was erected in the center of the Novgorod Kremlin. In 1875, 17,384 people lived in Novgorod, along with military units. 12 small enterprises employed only 63 workers.
Novgorod in the 20th century
Despite the increased interest in its history, Novgorod both at the end of the 19th century and at the beginning of the 20th century remained a typical provincial town of the Russian Empire, despite its status as a regional capital. In 1914, the population of Novgorod was about 28,200 people.
In 1927, as a result of the administrative-territorial reform carried out in the USSR, the Novgorod Governorate became part of Leningrad Oblast. The Leningrad leadership viewed the Novgorod land as a rural region. No industrialization was planned.
From August 15, 1941 to January 20, 1944, during the Second World War, Novgorod was occupied by German and Spanish troops (“The Blue Division”). The war caused huge and in many ways irreparable damage to the monuments of the city itself and its environs. All wooden buildings burned down. The most valuable collections of archeology, history and art were plundered from the Novgorod museum, which was not completely evacuated in time. Almost the entire city infrastructure and industrial enterprises were destroyed, world famous monuments of Novgorod architecture were turned into ruins.
On July 5, 1944, Novgorod Oblast was formed. The transformation of Novgorod into the administrative and economic center of a separate region had a beneficial effect on the acceleration of its restoration. On November 1, 1945, Novgorod was included in the list of 15 Soviet cities subject to priority restoration. In addition, a special decree was issued on the restoration of architectural monuments. One of the first to be restored was the Millennium of Russia monument.
In the post-war years, the presence of large undeveloped areas and wastelands after the dismantling of the rubble of destroyed buildings in the city center made it possible to begin extensive archaeological research. The results of these studies were numerous finds of objects of old Russian art and everyday life. One of the most important finds was the discovery of the first birch bark letter on July 26, 1951. Archaeological research continues to this day.
In the 1950s-1970s, the main restoration work of architectural monuments was carried out. Novgorod became known as the center of all-Union and international tourism. In 1964, not far from the old Yuryev Monastery on the shore of Lake Myachino, the creation of the Vitoslavlitsy Museum of Folk Wooden Architecture began. In 1967, the population of the city was about 107,000 people.
In 1992, 37 unique monuments of old Russian culture in Novgorod were included in the UNESCO World Cultural Heritage List. The population of the city reached its maximum and amounted to 235 thousand people.
On June 11, 1999, the President of the Russian Federation Boris Yeltsin signed the federal law “On renaming the city of Novgorod, the administrative center of Novgorod Oblast, into the city of Veliky Novgorod.” Also in the 1990s, a lot of streets in the city center received their historical names back.
Monuments of Veliky Novgorod
Victory Monument in Veliky Novgorod
Author: Sergey Duhanin
Light tank T-70 in Veliky Novgorod
Author: Konstantin Matekhin
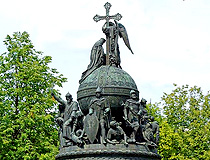
Monument to the Millennium of Russia in Veliky Novgorod
Veliky Novgorod - Features
Veliky Novgorod is deservedly called “the father of Russian cities”. In this place the Russian statehood was born. The city stands on the banks of the Volkhov River, 6 km from Lake Ilmen, 575 km north-west of Moscow and 190 km south-east of St. Petersburg. Due to similar names, Veliky Novgorod is often confused with Nizhny Novgorod. And this applies not only to foreigners, but also to residents of Russia.
The Volkhov River divides the city into two parts: Sofia and Torgovaya (Trade) sides. The Sofia side got its name from the Sofia Cathedral, which is about one thousand years old. The main part of the city is located here, including the Novgorod Kremlin and the historic center, as well as new districts.
In the old days, there was a large market on the Trade side - Torg. Today, it is built up mainly with private houses. The Yaroslav’s Courtyard is also located here. It is a historical and architectural complex on the site where the residence of Yaroslav the Wise (Prince of Novgorod in 988-1015) used to be.
The climate of Veliky Novgorod is moderately continental, with cold snowy winters and moderately warm summers. The average temperature in January is minus 9.2 degrees Celsius, in July - plus 17.3 degrees Celsius.
Novgorod Oblast has a unique transport and geographical position. The main highway, rail, air, and water transport routes connecting St. Petersburg and Moscow pass through its territory. Public transport in the city is represented by buses, trolleybuses.
The region’s largest employer is the chemical fertilizer plant “Acron”, which produces ammonia, saltpeter, nitric acid, and other substances. This enterprise is one of the world’s largest fertilizer producers. The plant in Veliky Novgorod employs about 5 thousand people.
Tourism is gradually becoming more and more important in the city’s economy. Veliky Novgorod is rightly called the city-museum of Old Rus. No other city in Russia has so many remarkable architectural monuments and monumental paintings of the 11th-17th centuries. The architecture of Veliky Novgorod is unique because a lot of old churches have survived here. A significant part of them were erected in the period from the 11th to the 16th centuries. In some churches, old wall paintings have been preserved, which are of great cultural value.
The main discovery made on the territory of Veliky Novgorod is more than 1,000 preserved birch bark letters of various contents written in the 11th-15th centuries. These include business letters, love letters, recipe notes, Bible commentaries, commercial calculations, and even student scribbles.
Main Attractions of Veliky Novgorod
Novgorod Detinets (Kremlin) - the fortress of Veliky Novgorod located on the left bank of the Volkhov River, the oldest preserved kremlin in Russia and the most northern one. The first mention of it in chronicles dates back to 1044. It is an architectural monument of federal significance. Novgorod Detinets as part of the historic center of Veliky Novgorod is included in the UNESCO World Heritage List.
The construction of the stone fortress was completed by the end of the 15th century. About 1.5 kilometers of fortress walls, nine towers, and old churches have survived to this day. A road going through the Novgorod Kremlin leads to the bridge connecting the Sofia and Torgovaya sides of the city. The 41-meter watchtower known as “Kokuy” offers a great view of the entire city and its surroundings.
Today, it is the cultural and tourist center of Veliky Novgorod. Here you can find the main expositions of the Novgorod Museum-Reserve (the exposition of the Old Russian arts and crafts and jewelry in the Chamber of Facets; “History of the Novgorod Region”, “Old Russian icon painting”, “Russian art of the 18th-20th centuries”), restoration workshops, a library, philharmonic society, college of arts, and a music school. The Novgorod Kremlin is surrounded by a spacious park. A walk from the railway station to the Novgorod Kremlin takes about 20 minutes.
Saint Sophia Cathedral (1045-1050) - the main Orthodox church in Veliky Novgorod located on the territory of the Novgorod Kremlin, one of the oldest churches in Russia. Churches of this type were built in Rus only in the 11th century. Sophia Cathedral was built in the Byzantine style, has a pyramidal structure and 6 domes. This is one of the symbols of Veliky Novgorod.
The belfry of St. Sophia Cathedral rises above the Novgorod Kremlin in the form of a wall with five spans in the upper part. This type of structure was invented during the reign of the Novgorod Archbishop Euthymius II and then repeated in Russia only twice.
Monument to the Millennium of Russia (1862) - a magnificent monument more than 15 meters high erected opposite the St. Sophia Cathedral in honor of the millennium anniversary of the legendary vocation of the Varangians to Rus. The monument consists of 128 figures. At the very top you can see an angel - the personification of Orthodoxy and a woman depicting Rus, below - princes, church hierarchs and enlighteners, who took part in important historical events that happened over the thousand-year history of Russia.
Yaroslav’s Courtyard and Torg - an architectural complex located opposite the Novgorod Kremlin, on the other bank of the Volkhov River. Both banks are connected by a pedestrian bridge. Several monuments of the 12th-16th centuries have survived on its territory, including the Nikolsky Cathedral (1113) and the Church of Paraskeva Pyatnitsa (the 13th century). The place was named after Prince Yaroslav the Wise. In old times, fairs were held here. The most recent construction is the arcade of the Gostiny Dvor, which consists of several dozen white-stone arches.
St. George’s (Yuriev) Monastery . Founded in 1030, it is one of the oldest monasteries in Russia, a cultural heritage site of federal significance. The monastery is located on the southern outskirts of Veliky Novgorod on the bank of the Volkhov River. On the territory of the monastery there are St. George, Spassky, and Holy Cross Cathedrals, a four-tiered bell tower 52 m high, and several old churches. Crowned with three silvery domes, St. George’s Cathedral is a wonderful example of Old Russian architecture. The Vitoslavlitsy Museum is located nearby. Yur’yevskoye Highway, 10.
Museum of Folk Wooden Architecture “Vitoslavlitsy” . This open-air exhibition was opened in 1964. 22 wooden architectural monuments of the 16th-20th centuries - churches, residential buildings, and outbuildings - were brought here from different districts of the Novgorod region.
Inside the peasant huts, you can see recreated old interiors: “Winter Life”, “Wedding”, “Wool Felting Craft”, and others. Folk festivals are also held on the territory of the museum. On the second floor of the souvenir shop there is the Museum of Irons with a unique collection of irons of the 18th-20th centuries. Yur’yevskoye Highway, 14.
Center for Musical Antiquities named after V.I. Povetkin . The unique collection of this museum acquaints visitors with the old musical instruments of Rus. Here you can also hear old Russian music. Most of the exhibits date back to the 10th-15th centuries. For the guests of the center, folk songs of the Russian North-West and North are performed. Choir concerts are held on holidays. Il’ina Street, 9b.
Art Museum . The permanent exhibition of this museum is dedicated to Russian art of the 17th-20th centuries. It was opened in the historic building of the Noble Assembly in 2001. The rich collection of the museum includes paintings, drawings, sculptures, miniatures, etc.
Among the most valuable exhibits are paintings created by such masters as K. Bryullov, I. Repin, A. Aivazovsky and sculptures, including M. Antokolsky and M. Vrubel. The museum’s collection of Russian art objects is considered one of the best outside Moscow and St. Petersburg. Sofiyskaya Square, 2.
Museum of Artistic Culture of the Novgorod Land . This museum was opened in one of the buildings of the Desyatinnyy monastery in 2002. The exposition is composed of works by Novgorod artists of the late 20th - early 21st centuries. In addition to paintings, visitors can look at porcelain and glass products made by local craftsmen. Desyatinnyy Lane, 6.
Novgorod city of Russia photos
Pictures of veliky novgorod.
Veliky Novgorod architecture
Author: Elena Abramova
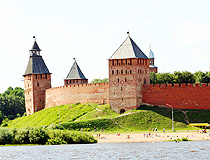
Veliky Novgorod Detinets (Kremlin)
Author: Ismail Soytekinoglu
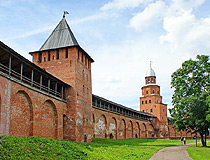
Veliky Novgorod Fortress
Picturesque churches of Veliky Novgorod
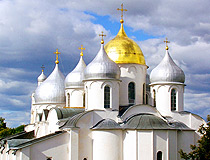
St. Sophia Cathedral in Veliky Novgorod
Author: Zaritsky Igor
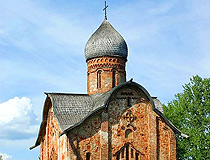
Peter and Paul Church in Veliky Novgorod
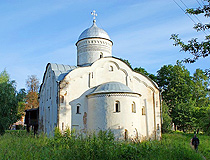
Church of Clement, Pope of Rome in Veliky Novgorod
Old churches of Veliky Novgorod
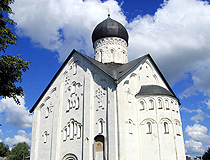
Church of the Transfiguration on Ilyin in Veliky Novgorod
Author: Sergey Popov
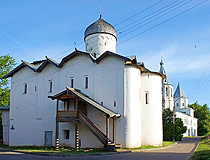
Myrrhbearers Church in Veliky Novgorod
The questions of our visitors
There are several ways of going from the airport of St. Petersburg to Veliky Novgorod.
The fastest one and of course the most expensive is to go by taxi from the airport straight to the destination city. The price is about 4,500-5,000 Rubles (about 70-80 USD).
Another way is to go by train. From the airport you should go to Vitebsky railway station, departure: 7:53, arrival: 13:06 local time. Also you can go to Moskovsky railway station. There are two trains: the first one departs at 8:12 and the second one - at 17:18). Not sure about the price of the tickets but much cheaper than going by taxi.
The third variant is to go by bus. You should go to the bus station at Obvodnoy Canal Embankment. The first bus departs at 7:30; the latest - at 21:30.
- Currently 3.11/5
Rating: 3.1 /5 (190 votes cast)
Sponsored Links:

IMAGES
COMMENTS
Explore math with our beautiful, free online graphing calculator. Graph functions, plot points, visualize algebraic equations, add sliders, animate graphs, and more.
Sailboat Calculator Art | Desmos. Loading... Explore math with our beautiful, free online graphing calculator. Graph functions, plot points, visualize algebraic equations, add sliders, animate graphs, and more.
In this video, learn how to use inequalities, restrictions, and polygons to create a dynamic sailboat in the Desmos 2D Graphing Calculator!Learn more about c...
Explore math with our beautiful, free online graphing calculator. Graph functions, plot points, visualize algebraic equations, add sliders, animate graphs, and more.
Math Art in 3D. Desmos 3D adds another dimension for creativity. Many of the same strategies used in 2D, such as inequalities, restrictions, custom colors and more can be applied in 3D. A great starting place for art in 3D is utilizing the built in function 'sphere.'. You can try out this function and start creating with the Build a Snowman ...
Here, the scene we New Englanders desperately miss this time of year. #Math Ts: What can your Ss create using #Desmos? https://desmos.com/calculator/eorincuf...
Basics of using the graphing calculator at desmos.com.Update: there's so much more you can do with Desmos. Here's my more recent video which includes anima...
The graphing calculator Desmos recently held a competition called the Global Math Art Contest. People aged 13-18 submitted artwork they created with the graphing calculator using combinations of math curves. The judging is based on creativity, originality, visual appeal, and the math used to create the art.
A subreddit dedicated to sharing graphs created using the Desmos graphing calculator. Feel free to post demonstrations of interesting mathematical phenomena, questions about what is happening in a graph, or just cool things you've found while playing with the calculator.
And with that, let's proceed straight into our Desmos Art guide in computational sketching, which — as you might have guessed — is going to be both fun and informative — even if you have no intention whatsoever of using any graphing calculator in the near future. Step 1: Initial Setup — Source Picture. Step 2: Divide and Conquer.
And to draw curves, input more complex equations—parabolas, hyperbolas, sine and cosine functions are just the start. Let's look at how to draw these: Line: y = mx + b. Circle: (x - 1)^2 + (y - 3)^2 = 9. Parabolic Curve: y = ax^2 + bx + c. Start with these basic shapes on your Desmos canvas to grasp how the equations turn into visual art.
By following these steps, you can design an animated boat using Desmos, incorporating multiple functions and shading. Remember to adjust the coefficients and parameters of each function to create the desired shapes and animations. ... Create the Desmos art (it can be a sun, flower, bird, cloud, or your hobby) based on 4 types of mixtures: ...
Sail calculator pro v3.54 - 3200+ boats, So, if the boat with the highest sail area to displacement has a value of 48, a boat with a sail area to displacement of 24 would receive a value of .5. for a 'low' search it is the inverse. that is, if the boat with the lowest capsize ratio has 1.3, a boat with a capsize ratio of 3.9 would recei ve a ...
Share this event: MU Desmos Art and Sip Save this event: MU Desmos Art and Sip Accelerated Adults Piano Crash Course 1: Learn to play the Piano in 2HRS! Sat, Sep 21, 11:30 AM
Eventbrite - UWA Mathematics Union presents MU Desmos Art and Sip - Friday, August 30, 2024 at EZONE Central 209, Crawley, WA. Find event and ticket information. Art and Sip but with a twist! Let the UWA Maths Union teach you the ways of creating your very own artistic masterpiece using maths!
Explore math with our beautiful, free online graphing calculator. Graph functions, plot points, visualize algebraic equations, add sliders, animate graphs, and more.
Answer 1 of 2: Is it en route from moscow to st petersberg? : Get Novgorod Oblast travel advice on Tripadvisor's Novgorod Oblast travel forum.
Velikiy Novgorod is a small city not far from Saint Petersburg and Moscow. Being the oldest city in Russia, it is often called a museum of the ancient Rus and was given the status of the World Heritage Site of UNESCO. No other city in Russia managed to preserve such a number of pieces of architecture and art from the very ancient times.
Explore math with our beautiful, free online graphing calculator. Graph functions, plot points, visualize algebraic equations, add sliders, animate graphs, and more.
Travel forums for Novgorod Oblast. Discuss Novgorod Oblast travel with Tripadvisor travelers
Veliky Novgorod - Overview. Veliky Novgorod or Novgorod the Great (just Novgorod until 1999) is a city in the north-west of Russia, the administrative center of Novgorod Oblast. It is one of the oldest and most famous cities in Russia with more than a thousand years of history. The population of Veliky Novgorod is about 224,800 (2022), the area - 90 sq. km.
Explore math with our beautiful, free online graphing calculator. Graph functions, plot points, visualize algebraic equations, add sliders, animate graphs, and more.